
Lifetime Value
Part 2 of 3
Hypora Group · Cost Validation Series · Episode 03
In this article, we are going to discuss Lifetime Value. While a standalone in theory, the concept works best in a trio. If you haven't read Part 1 on Customer Acquisition Cost, I'd encourage you to go back — a lot of what follows assumes you already have a CAC number in hand.
Housekeeping
Lifetime Value — LTV from here on — is calculated as:
LTV = Value per customer × Customer's Lifetime
And that is, again, where the agreement ends.
Defining Key Terms
A lot of billable hours have been spent defining and calculating words like value.
A lot of billable hours have been spent parsing customer demographics for client segmentation.
A lot of billable hours have been spent parsing product offerings for product segmentation.
A lot of billable hours have been spent defining lifetime.
In the same manner as our CAC calculation, let's not allow perfection to be the enemy of good enough. As long as the number is defensible, repeatable, and documented — that is sufficient. For now.
D.A.S.S. Inc.
Our fictional $25M company carries through this entire series. D.A.S.S. Inc. — Dorian's Attic Storage Solutions — offers three services:
Labor Moving — removing attic items and storing them offsite (median revenue: $10k/job)
Labor Solutions — building out storage within the client's existing attic (upon request)
Storage (air-conditioned) — $200/month
Storage (outdoors) — $100/month
Step 1 — Client Segmentation
Start simple, and start with what every business already has: sort your client base into revenue quartiles. Choose a time horizon — five years is the recommendation.
Most owners, executives, and partners focus on the day or the near future. Building a business in America is not easy. This list represents every client your organization added tangible value to. That should be celebrated.
Use the 5 W's as a quick observation framework for each quartile: Who are they (size), what are they (industry), where are they (geography), when are they (relationship start date), why are they (what problem did you originally solve). You're just making observations and looking for contradictions that built up over the course of history or messaging.
Now the hard part: put it away and go back to the LTV calculation.
D.A.S.S. Inc. — Step 1 (single-year view)
| Tier | Quartile A | Quartile B | Quartile C | Quartile D |
|---|---|---|---|---|
| Customers | 250 | 250 | 250 | 250 |
| Total Revenue / Customer | $12,000 | $6,000 | $10,000 | $7,000 |
At first glance, you might conclude that Quartile A and C are the strategies to lean into. But spread over a five-year history, a different picture emerges:
| Year | Quartile A | Quartile B | Quartile C | Quartile D |
|---|---|---|---|---|
| Year 1 | $2,400 | $11,200 | $10,000 | $5,000 |
| Year 2 | $2,400 | $1,200 | $0 | $2,000 |
| Year 3 | $2,400 | $1,200 | $0 | $0 |
| Year 4 | $2,400 | $1,200 | $0 | $0 |
| Year 5 | $2,400 | $1,200 | $0 | $0 |
| Total / Customer | $12,000 | $16,000 | $10,000 | $7,000 |
At second glance, Quartile B takes the commanding lead. The single-year view hid it entirely.
This is also where the first structural contradiction surfaces. A sales team focused on commission will chase the highest single sale — Quartile A and C. An owner with a long-term lens gravitates toward A and B. That misalignment is common and rarely discussed explicitly.
Step 2 — Client Churn Rate
For the number itself, don't segment beyond project clients versus recurring revenue clients. Both matter, but each deserves its own metric. Take your total recurring revenue client base and calculate one overall churn rate: what percentage of customers, in a given period, ended the relationship.
A warning from one operator to another: you are going to want to add variables, and they will have sound reasoning. We agree with every one of them — and we still say don't. The problem is repeatability. The more variables you add, the more precise your LTV is at this exact moment. We are focused on building a solid foundation. The less variables, the better.
Data Traps
Two more reality checks before you trust this number:
Outliers. If you land a massive job — D.A.S.S. Inc.'s $10 million attic build-out, or whatever your equivalent is — congratulations. And also: don't count it. If a number would make you call your business partner just to brag, it doesn't belong in the calculation. It belongs in a footnote, right after you call everyone and brag about it.
Sample size. LTV:CAC is good to know, but with a client base of 10 customers, it's mostly noise wearing a metric's clothing — one customer leaving early or staying a decade swings the whole number. At that stage, the priority isn't LTV. It's product-market fit: is the solution profitable on its own, and is there a total addressable market big enough to make this exercise worth revisiting later? LTV is a scaling question. A ten-customer business is still answering a survival question.
D.A.S.S. Inc. — Step 2 (five-year view with churn)
| Year | Quartile A | Quartile B | Quartile C | Quartile D |
|---|---|---|---|---|
| Year 1 | $2,400 | $11,200 | $10,000 | $5,000 |
| Year 2 | $2,400 | $1,200 | $0 | $2,000 |
| Year 3 | $2,400 | $1,200 | $0 | — |
| Year 4 | $2,400 | $1,200 | $0 | — |
| Year 5 | $2,400 | $1,200 | $0 | — |
| Total / Customer | $12,000 | $16,000 | $10,000 | $7,000 |
| Churn Rate | 10% (10 yr) | 20% (5 yr) | Project — n/a | Project — n/a |
Here's where time horizons create a problem. Quartile A shows a 10-year relationship, but we only captured five years of data. D.A.S.S. Inc. also charges labor for the movement of items into storage — revenue that isn't showing in Quartile A yet.
To resolve the gap: add the median labor price into Year 1 for Quartile A, and extend the projection to Year 10. Today's prices across the board — diminishing returns kicks in beyond that point.
| Year | Quartile A | Quartile B | Quartile C | Quartile D |
|---|---|---|---|---|
| Year 1 | $12,400 | $11,200 | $10,000 | $5,000 |
| Year 2 | $2,400 | $1,200 | $0 | $2,000 |
| Year 3 | $2,400 | $1,200 | $0 | $0 |
| Year 4 | $2,400 | $1,200 | $0 | $0 |
| Year 5 | $2,400 | $1,200 | $0 | $0 |
| Years 6–10 | $12,000 | $0 | $0 | $0 |
| Total / Customer | $34,000 | $16,000 | $10,000 | $7,000 |
| Churn Rate | 10% (10 yr) | 20% (5 yr) | Project — n/a | Project — n/a |
To simplify, blend Quartile A and B — the two recurring revenue tiers — together:
| Quartile A | Quartile B | Blend | |
|---|---|---|---|
| Customers | 250 | 250 | 500 |
| Total Revenue / Customer | $34,000 | $16,000 | $25,000 avg |
| Churn Rate | 10% (10 yr) | 20% (5 yr) | 15% (7 yr) |
Step 3 — Finalizing Lifetime Value
LTV = One-Time Charge(s) + (Recurring Revenue ÷ Churn Rate)
D.A.S.S. Inc. — Step 3 (blended LTV)
One-time charge (blended): $10,000
Annual recurring revenue (blended): $1,800
Churn (blended): 15%
LTV: $22,000
Notice that doesn't match a simple average of the two tiers ($25,000 from the table above). Averaging churn rates and averaging totals are not the same operation — the gap between them is the cost of skipping the derivation.
It's also best practice to isolate the one-time charge rather than fold it into the recurring figure. Many companies are the inverse of D.A.S.S. Inc. — they start with small recurring revenue and earn a large project later. Isolating the variable helps you understand client behavior or slippage that may be occurring in future years.
Return of the CAC
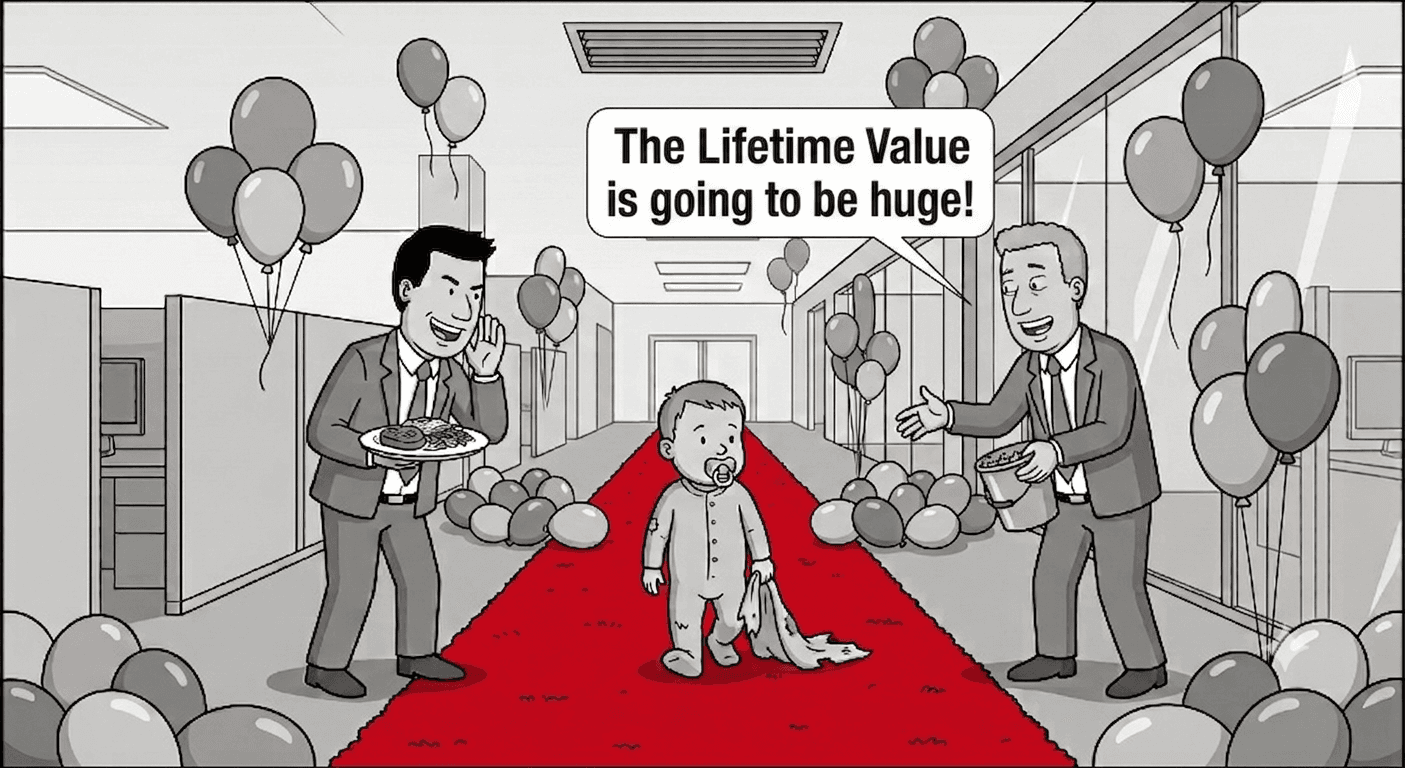
In Part 1, we calculated D.A.S.S. Inc.'s CAC at $1,650 — but we couldn't answer whether that was good or bad. Now we can.
| Value | Amount |
|---|---|
| LTV (blended) | $22,000 |
| CAC | $1,650 |
| LTV:CAC Ratio | ≈ 13:1 |
A 13:1 ratio is healthy. It indicates the marketing and advertising budget could likely be increased if the total addressable market justifies it.
Recap
In three steps, D.A.S.S. Inc. has learned the following:
LTV:CAC is very healthy — the marketing budget could be increased if the market justifies it.
Market position strategy should be focused on storage (recurring revenue), not one-time labor jobs.
A potential incentives mismatch between the sales team and the owner is visible in the data.
Moving job incentives should be applied and structured around choice of storage tier.
And this is where most stop. Or many never actually begin.
But there's one more step — and it's the one that makes LTV and CAC actually mean something together.
Part 3: Lifetime Profitability Value (LTPV)
Back at the start, we mentioned LTPV — Lifetime Profitability Value — as the third member of the trio. An easy calculation with deep insights. That's where this series ends, and where the real decision-making begins.
© Hypora Group · HyporaGroup.com · Strengthening From Within