
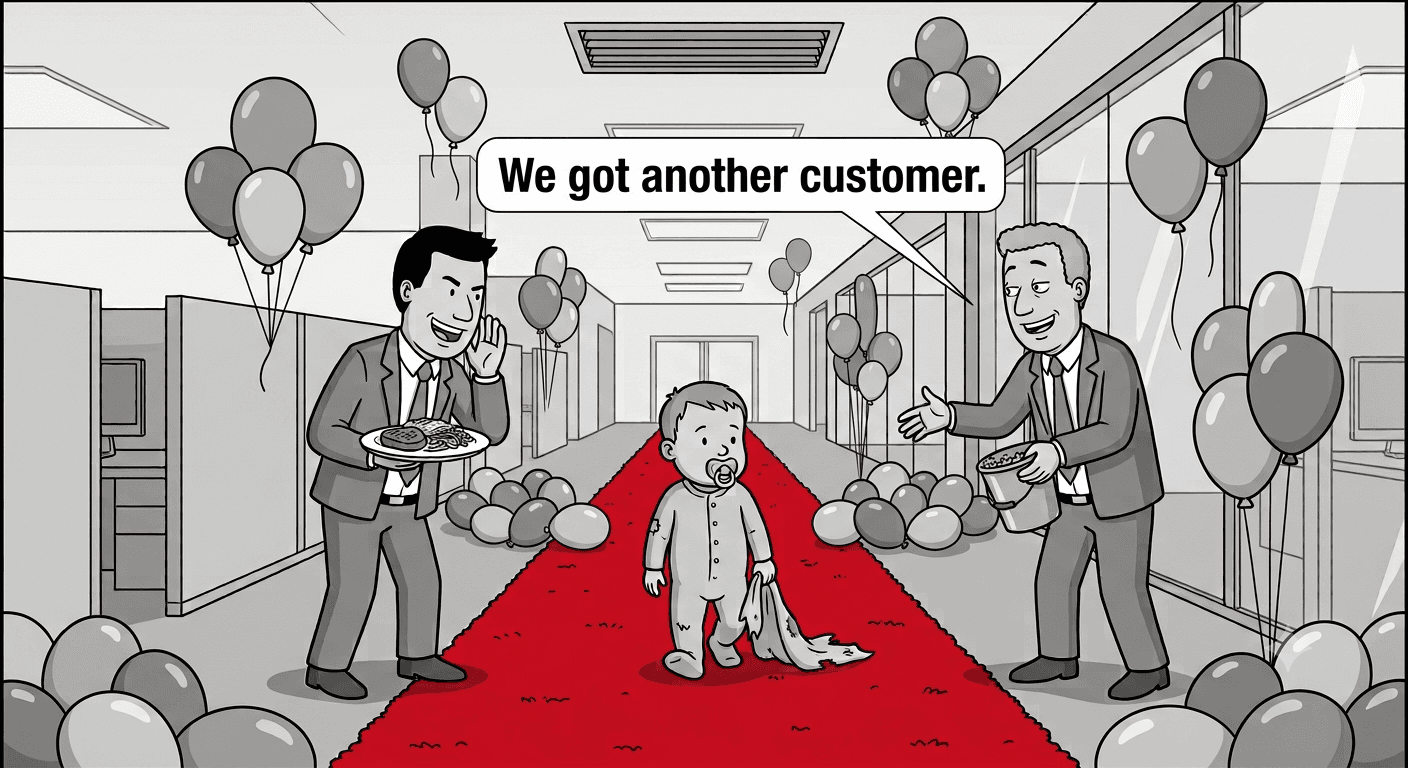
Customer Acquisition Cost
Part 1 of 3
Hypora Group · Cost Validation Series · Episode 02
I don't normally tell people to stop reading. But for those with commitment issues, perhaps it's best.
Customer Acquisition Cost — CAC from here on out, because carpal tunnel is real — is best understood as a trio. You typically hear it as a solo. At Hypora Group, we'd make the case it's three-part harmony or nothing.
Member Name: Customer Acquisition Cost
Goes By: CAC
Member Name: Lifetime Value
Goes By: LTV
Member Name: Lifetime Profitability Value
Goes By: LTPV
In rock climbing, you tie in three for redundancy up to the point of diminishing returns. Same principle here. Good to know one. Better to know all three.
Part 1 is CAC. We'll get to the rest if you can keep up.
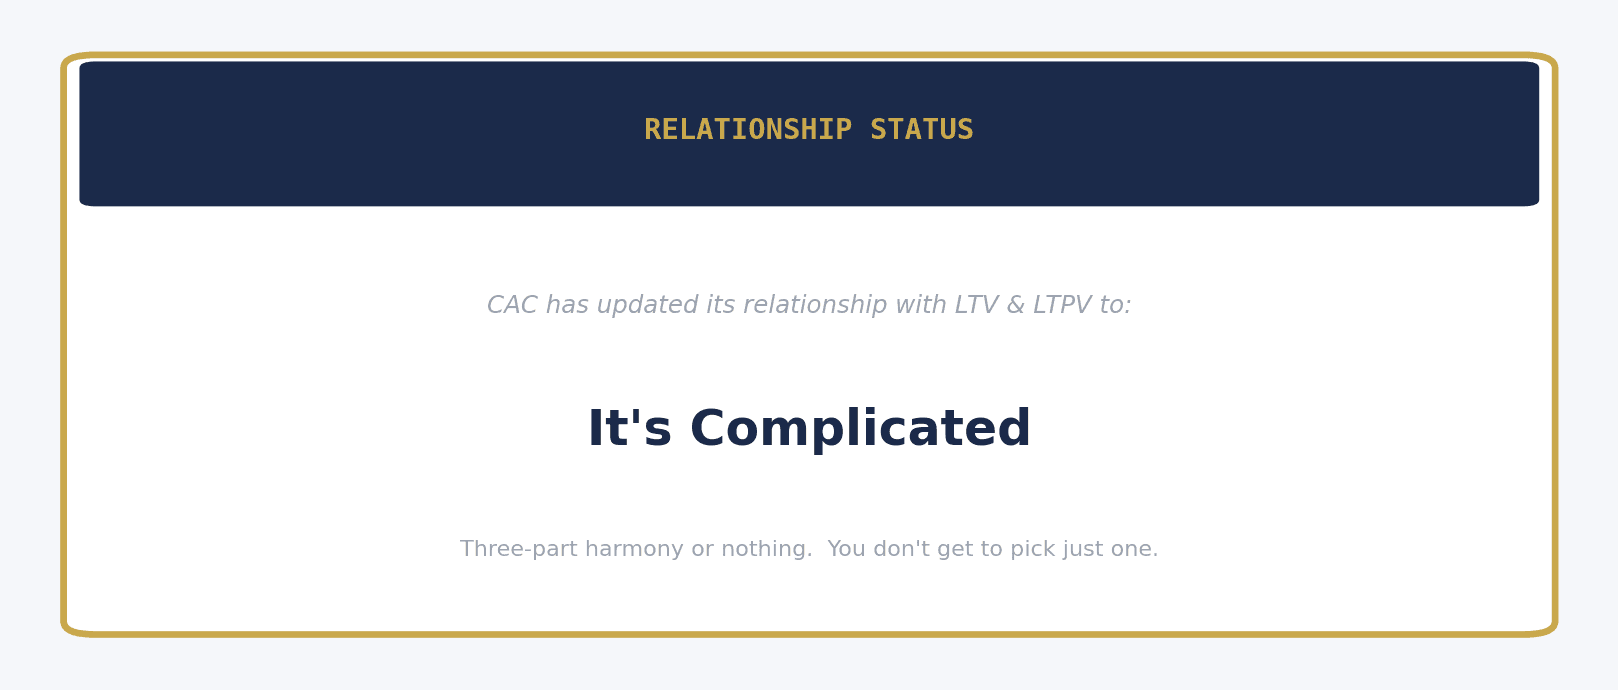
The trio. You don't get to pick just one.
Housekeeping
CAC is one of the dark arts of business. Bring up your number in a room of ten people and you'll get eleven different reactions — nine of them wrong, two of them confidently wrong. If someone quotes you their CAC without explaining how they built it, do your own due diligence. Looking at you, investor relations.
The short version: how much did it cost you to acquire this customer?
The long version is what we're here for.
Art Masquerading as Science
To loosely paraphrase Keynes: it is better to be roughly right than precisely wrong.
CAC moves. It shifts with the calendar, with your definition of "customer," and with whoever built the formula. Treat it as a range, not a number. A roughly right range leaves you to fight another day. A precisely wrong number gives you false confidence right up until it doesn't.

Precise. Confident. Extinct.
The Trap Nobody Mentions
The formula looks simple: marketing spend divided by new customers. The organizational motives behind those two words are where things tend to fall apart.
On the spend side: are you counting ad budget only? Or ad budget plus sales compensation, tools, trade shows, and the half-day your operations manager spent onboarding a new account? The gap between a narrow definition and a fully-loaded one can be 100% or more.
On the customer side: are you counting everyone who raised their hand — free trials, tire-kickers, people who never paid? Or only the net new paying accounts that actually stayed?
Those aren't fine-print distinctions. They produce completely different numbers from identical business activity.
The time horizon is the third trap. Spend in October may not generate customers until January.
A company ramping up marketing looks inefficient today and brilliant next quarter. A company cutting spend looks brilliant today and starved next quarter. If you listen to quarterly earnings calls for entertainment — and some of us do — this is the oscillating argument you keep hearing: margins are too low this quarter, new accounts are too low the next. The math is chasing itself.
D.A.S.S. Inc.
Our fictional $25M company that will carry us through this entire series.
Open your accounting software. Pull the marketing and advertising line — not the whole cost structure, just that line. Now pull your client list and count the net new paying customers added this year versus last. Divide the first number by the second.
That's your starting point.
In practice:
Revenue: $25,000,000
Marketing & Advertising: $120,000
Trade Events (sponsoring the 9th hole at the local golf tournament counts): $45,000
Net new paying customers, year-over-year: 100
CAC: $1,650
Is $1,650 good? Entirely depends on what that customer is worth over their lifetime — which is Part 2's problem. For now, you have a number. A real, defensible, repeatable number built from two lines and basic subtraction. That's further than most.
Now Let's Talk About Netflix
Netflix has been publicly traded since 2002. They filed 10-Ks. They disclosed everything.
And even they couldn't agree on their own CAC.
The year 2000. Netflix spent $25.7 million on marketing. Simple enough. Now watch what happens when you change only one variable — the denominator.
Netflix's own calculation:
$25.7M divided by 515,000 gross subscriber additions, which included every free trial that walked through the door.
Their answer: $49.96 per subscriber.
The Hypora Group calculation:
$25.7M divided by 185,000 — the net new paying subscribers who actually stuck around (292,000 at year-end minus 107,000 the year before).
That answer: $139.06 per subscriber.
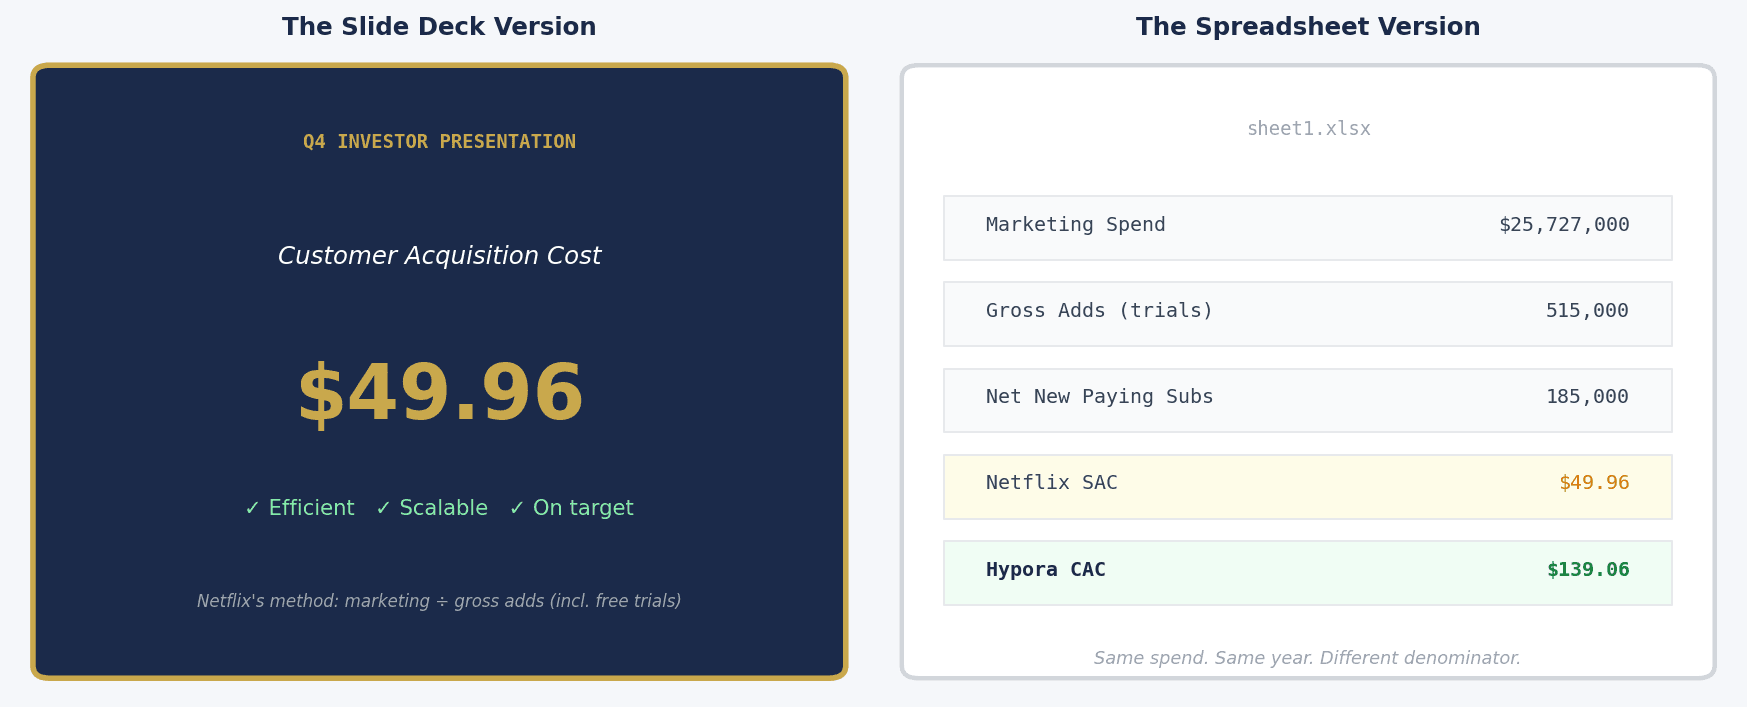
Same company. Same year. Same $25.7 million. Nearly three times apart.
Neither number is wrong. Netflix's method answers one question. The net-add method answers a different question. The problem is when you present one as if it answers both.
Netflix's version — $49.96 — makes acquisition look efficient. Scalable. The kind of number that plays well in a slide deck.
The net-add version — $139.06 — reflects what it actually cost to move the subscriber base.
This isn't a Netflix problem. This is a CAC debate. It reflects the choices of whoever built it, and those choices are rarely disclosed alongside the headline number. We tracked Netflix both ways from 1999 to 2024 — the full dataset is in the footnotes. The two methods produce figures anywhere from 1.2x to 4.3x apart depending on the year. The widest gap shows up in 2007, when Netflix was spending heavily while net subscriber growth stalled. Same dollars. Completely different picture of the business.
What This Means for You
You are not Netflix. You don't have 300 million subscribers or a $2.9 billion marketing budget or a team whose job is to craft the framing before the number goes public.
What you have is something Netflix lost a long time ago: a small enough customer base that you actually know every name on the list. You could count your net new paying customers by hand if it came to that.
That's not a limitation. That's an advantage. Your CAC, built the simple way, is more honest than the disclosed figures of most public companies — because you have no incentive to optimize the presentation.
Build it. Track it the same way every period. And when someone quotes you an industry benchmark, ask them which version of the denominator they used.
The answer to that question tells you more than the number itself.
The first major original production of Netflix was House of Cards, released in 2013. Built around the character Frank Underwood — a man driven by ambition who constructed his success on a foundation of lies, until it came crashing down like a house of cards.
Don't be a Frank. Build your CAC on the truth and focus on staying in the game for the long run.
A solid foundation beats a pretty structure every time.
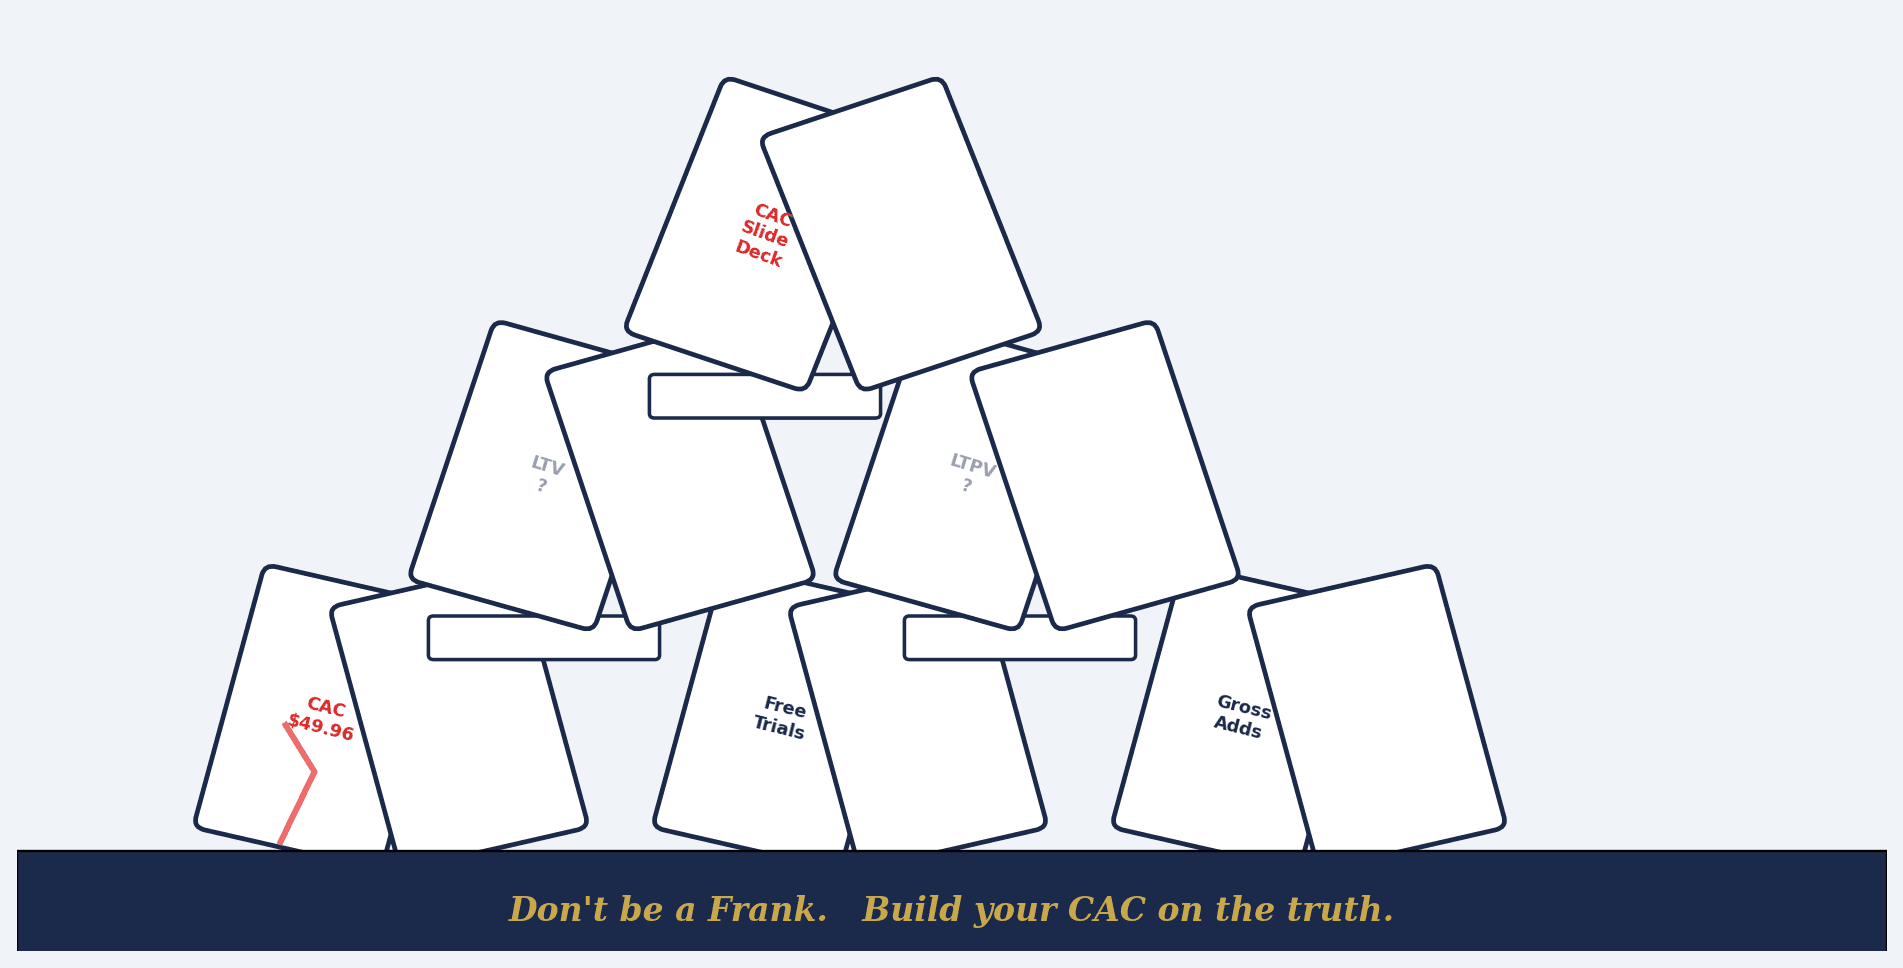
A solid foundation beats a pretty structure every time.
Part 2: Lifetime Value
The second member of the trio, and the only thing that makes CAC mean anything at all.
Full Netflix CAC dataset (1999–2024), dual-method comparison, and source documentation — Download the Excel file
© Hypora Group · HyporaGroup.com · Strengthening From Within